

Chart of the Week
One of the numbskull ideas that have always been part of political discussions is that the ups and downs of the economy and/or the financial markets are responses to the legislative or executive actions promoted by whoever is in the Oval Office at the moment. It doesn’t take a lot of thinking to realize that economic events and changes do not happen that way. There is this thing called gestation that lies between the passage of a law or the declaration of an executive order and the economic and financial effects that result from it. Those gestation periods can be weeks, but are much more often months or years.
It’s an election year. So, this week, Sean takes a look at how stocks perform during such years…
According to research by LPL Financial, “the S&P 500 has generated an average gain of 7% during presidential election years dating back to the 1952 election.”
That’s below the market’s long-term averages – but not catastrophically so.
But the data gets more interesting when broken down further.
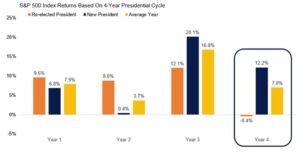
In years when we have a “lame duck” president – one who has served two terms already – the average return for the S&P 500 is an abysmal -0.4%.
But in years when a president is seeking reelection, like 2024, the average return of the market is 12.2%.
Why? Typically, the incumbent party tries to “prime the pump” before the election.
Whether it’s Republican tax cuts or Democrat handouts, this works by pushing more money into the US economy, encouraging growth.
You may ask: “Won’t this add to America’s insane deficits and debt levels? Won’t this make the US more susceptible to another inflation spike?”
Well, yes. But those are all problems for whoever is in office in 2025.
– Sean MacIntyre
Click here for Sean’s prediction for what will happen with inflation in the coming years.