

Chart of the Week: A Troubling Trend
M2 – otherwise known as “money supply” – is the term economists use to represent the amount of cash that is moving around in an economy at any particular time. It includes, as Sean points out below, such assets as the money we have in savings accounts, checking accounts, CDs, money market funds, traveler’s checks, and paper currency.
Money supply is not an indicator of the total net worth of an economy. Nor does it measure a country’s economic output. But it is a useful tool for economists because it can give them a hint about which way the economy is moving.
In the last two years, as the chart Sean presents demonstrates, M2 in the US has declined by more than 2%. That much activity has happened only four times before. And in each case, it preceded a major recession.
Thus, this latest two-year decline is something that all investors should be concerned about. But, Sean says, there is more to this recent turndown than meets the eye.
If you are wondering how strong or weak the US economy will be in the next few years, take a good look at the chart and then read Sean’s cautionary analysis. – MF
For all the talk of money printing that has pervaded media for several years, not many people have been talking about the money shredding that’s also been taking place.
Over the last two years, the money supply of the US has declined by over -2%.
Money supply, as measured by M2, tallies up all the cash-related assets held by households: savings deposits, balances in money market funds, paper currency, traveler’s checks, checking accounts, etc.
Less M2 means there’s less money floating around the economy.
And that has never been a good thing.
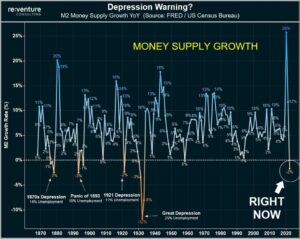
An analyst for Reventure Consulting looked at M2 going back to 1870. He found that there have been four times over the last 154 years when M2 fell by 2% or more: 1878, 1893, 1921, and 1931.
Those dates probably appear familiar to you because they also coincide with extraordinary unemployment, economic recessions, and massive stock market declines.
Why does this happen? When money supply is lower, people and businesses have – you guessed it – less money to spend. Consumption and investment levels decline, which can lead to deflation.
But here are the famous final words we must ask: Is this time different?
The previous declines in money supply did not follow unprecedented bouts of money printing.
The recent decline in M2 follows the Fed trimming the assets it had added to its balance sheet during 2008 and 2020, under a policy known as quantitative easing.
Despite the destruction of all this money, M2 is a whopping 35% higher than it was before the pandemic. There’s still plenty of money floating around the US economy. And the resilience of the labor market as well as the stickiness of our inflation problem suggests that the decline in M2 isn’t a serious problem yet.
What the decline in M2 does provide, however, is another troubling warning sign about the future of the economy and additional evidence that we should expect lower returns from US stocks in the years ahead.
– Sean MacIntyre
Check out Sean’s YouTube channel here.