
Is the American Middle Class Shrinking?
“The American middle class is shrinking!”
So said the headline. And it sounded right to me. Over the past 20 years, our elected officials and the Federal Reserve have done so many whacky things, trying to regulate the economy, that I have been expecting all sorts of bad economic news like this. “Well, I’ll write about it on Tuesday,” I decided. “I’ll explain how this unhappy fact supports my general theory of economics.”
Hmm….
But I don’t have a general theory exactly. I know a handful of facts. I’ve read the big names. And I have some commonsense notions based on experience. But a general theory? No.
Plus, I realized that I don’t know what “middle class” means. I mean, I understand that a middle-class family is neither rich nor poor. But surely there is a more precise way to define it!
I did some reading. It turns out there are several commonly used definitions. Pew Research Center, perhaps the most often-cited authority, classifies income of between $30,000 and $90,000 as middle class. For a family of two, the range is $42,000 to $127,000. For a family of three, $52,000 to $156,000.
Based on that, about 52% of Americans are middle class, with 29% earning less and 19% earning more.
That seems reasonable. About 50% in the middle and the rest above or below it.
But what about this recent headline about the middle class getting smaller? As you can see from the chart below, it’s true. In 1970, 61% of Americans earned enough income to be categorized as middle class. Today, that number is down by nearly 11%.
Who got poorer? And who got richer? In 1970, 25% of Americans and American families earned less than the bottom of the middle-class range, while 14% earned more than the top of the range. Today, the percentage of the population that is in the lower third has increased from 25% in 1971 to 29% in 2021. And the percentage that is in the upper third has grown from 14% to 21%.
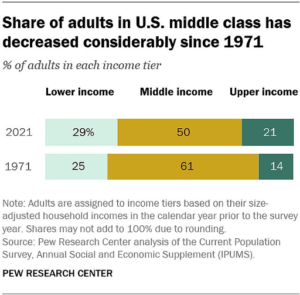
So, 7% of the population got richer. And 4% got poorer. Thus accounting for the 11% differential.
What happened? And why didn’t we notice?
At one level, the answer to the first question is easy. Over that 50-year span, the cost of living increased a bit more each year than did the rise in average wages.
Some of that was due to a gradually aging population. (A higher percentage of retirees.) Some of it was due to two recessions, and particularly the post-2008 Great Recession. But except for a few noisy cranks, the biggest factor was pretty much ignored. And that was the fact that since that time our government has been quietly but steadily spending more money than it was collecting in taxes.
In 1971, President Nixon took the US dollar off the gold standard. What that meant, in the simplest terms, was that our elected officials could spend pretty much however much money they wanted to spend because they could balance the books by selling US treasury bonds. So long as there were buyers for US debt, they could continue to fund their save-the-world ideas, including the war against poverty, the war against drugs, and all the proxy wars we’ve been fighting since then, which I talked about in the March 11 issue.
In response to the threat of an economic crash after the real estate bubble burst in 2007 and 2008, Obama and then Trump and now Biden, supported by the House and the Senate, have accelerated the national debt. That not only made the US dollar more fragile, but also encouraged consumer debt, which rose alongside US debt.
Today, US debt stands at more than $30 trillion. And consumer debt at nearly $16 trillion.
To make matters worse, we have record-high inflation. US inflation rose 9.1% year-over-year in June, up from the 40-year high of 8.6% in May and the largest 12-month increase since November 1981. Rising costs of shelter, gas, and food were among the primary contributors to the increase. Energy prices rose 7.5% in June, with gas prices up 11.2% from May. You can see the data release here.
So that’s where we find ourselves now. And the picture we face – with the economy moving into another recession – doesn’t look good. More on this next week.
For now, if you’d like to read more on this depressing subject, click here and here.
A Ray of Hope or an Illusion?

Not everyone thinks the US economy is in trouble. President Joe Biden said the most recent jobs report (July 8) showed “significant progress” towards economic health. He didn’t mention how the recovery in the employment rate was almost entirely a phenomenon of conservative red states, beating out liberal blue states in jobs growth by a considerable margin.
According to an analysis by the Labor Department, red states added 341,000 jobs since February 2020, while blue states lost 1.3 million jobs through May. “The states that gained the most, led by Florida, Texas, and North Carolina, are almost all red,” The Wall Street Journal noted. “The states that lost the most jobs are almost all blue, led by California, New York, and Illinois.”