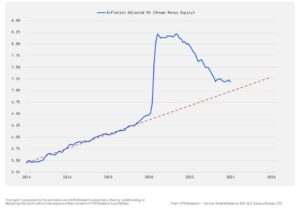
Chart of the Week: The Effect of Money Supply on Inflation
I’m not a stock market analyst. I’m not even interested in stocks. But I have a sizable percentage of my wealth (about 20% to 25%) in stocks because the stock market is a historically strong developer of wealth, averaging about 10% over the last 200 years.
About 12 years ago, working with several of the best stock analysts I know, I developed a system that I call Legacy Investing. It’s basically like investing in an index fund, but with some adjustments I made that I hoped would boost my return by 3% to 5% – in other words, give me the hope of being able to get a 13% to 15% ROI on my stocks over the long term.
So far, it’s worked out well. So I know the sensible thing to do is to is leave my portfolio alone, since trying to time the market’s ups and downs usually results in getting an ROI from it that is considerably lower than the 10% historical average. (Most individual investors trying to play that game earn about 2.5%.)
Notwithstanding this investing philosophy, I do keep my eye on about a half-dozen economic and market analysts who I know personally and whose thinking I know (from experience) is very good. And once in a while, when most of them are worried about the same dangers or excited about the same opportunities – and when their doubts and fears match my gut – I do make adjustments.
In the last year or so, I’ve become increasingly concerned about a significant drop in the value of my stock portfolio, and I’ve been thinking about what I can do about it. After reading Sean’s piece today, I decided to start taking some profits from my growth stocks and move that money into dividend-paying stocks and even some high-yielding but relatively safe bonds. – MF
This week’s chart of interest comes from the folks at EPB Research.
To understand the pressure that money supply has on inflation, they compared the broadest measure of money supply (called “M4”) to the pre-pandemic trendline:

M4 measures how much money is in the US economy, including demand deposits, time deposits, and Treasury bills.
The quantitative easing during the 2020 pandemic flooded the economy with money through both monetary policy and fiscal stimulus.
Even with efforts to remove money from the economy, called quantitative tightening, we are still about 2.6% higher than where we would expect to be had trends continued from last decade.
According to the analyst Lyn Alden, “per-capita money supply growth is one of the most closely correlated variables to consumer price inflation.”
Naturally, with this above-trend supply of money, we see from the latest data that inflation remains stubbornly high as well – up 0.4% in February 2024, for a total CPI increase of 3.2% over the previous 12 months.
That’s far higher than the Fed’s 2% target, meaning that we should not be expecting a rate cut anytime soon.
But at the same time, if the Fed keeps tightening and reducing the money supply, there will be little money for economic growth. That means fewer jobs.
And even with Fed tightening, the big culprits in our sticky inflation problem are transportation services, shelter, and food away from home.
The Fed can print money. The Fed cannot print cheaper houses, cheaper cars, and cheaper food.
So even if the Fed does successfully tighten money supply back to “normal,” that still probably will not be enough to fix the inflation problem in the US.
At least, not anytime soon.
As we get closer to the end of the year, bonds and dividend-paying stocks are going to appear more attractive as growth projections appear more unrealistic due to all this sticky inflation.
Over time, this will likely cause stock market prices to drag – especially since growth stocks now make up an outsized portion of the overall market.
– Sean MacIntyre
Check out Sean’s YouTube channel here.
 MarkFord