Last week, Sean demonstrated something that everyone that wants to understand the true state of our economy needs to understand: Many of the numbers we get from government agencies, numbers that are repeated uncritically by the press, are either misleading or downright deceptive because (1) the government wants taxpayers to be ignorant about economic issues, and (2) the kids that are hired to work as journalists are dumber than dental floss.

This week, Sean takes his mission to another level by talking about why all the misinformation put out by the government and published in major news outlets (including the NYT and the WSJ) is wrong, and what that should mean to you. – MF

Last week, I explained why job growth numbers published by the White House appeared to be misleading at best…

And covering up a serious problem at worst.

Today, I want to talk about unemployment numbers specifically, and why the headline unemployment figure is more than just overly simplified. It distorts the economic hardship people are facing.

We have been consistently hearing that the US unemployment rate is currently 3.7%.

But that does not mean that 96.3% of people in the US are employed.

This unemployment percentage does not include workers who have given up actively seeking a job or freelancers or gig workers who recently lost clients. It also doesn’t specify whether workers are employed part time or full time.

Once we factor in the total number of unemployed people, plus “marginally attached” and part time workers, that unemployment number surges to 8%.

Even when we do this, the figure doesn’t factor in the fact that, since 2020, the number of people who have “opted out” of the U.S. labor force has stayed stubbornly high.

And none of these numbers yet factor in how companies around America, in every industry, have been laying people off in droves.

There’s rot beneath the veneer of the US’s “surprisingly strong economic growth” in recent months.

Unless something changes, it will be spreading to the surface sooner rather than later.

– Sean MacIntyre

Sean is working on a video about this topic. You can be notified when it’s complete by subscribing to his YouTube channel here.

Chart of the Week: Misleading Job Growth Numbers

This week, Sean investigates reports of US job growth in recent months – reports that the Biden administration is touting as evidence of the success of “Bidenomics,”and a surprising number of economic commentators and market analysts are quoting as fact.

Of course, this runs contrary to the experience most Americans are having every time it comes to paying a bill or checking their bank balance. I’m grateful to Sean for helping me understand the reality that belies the headlines. – MF

The White House has entered full campaign mode. Central to its messaging has been the state of the economy.

Just look at the steady job growth in recent months, the White House says.

This “growth” has naturally caused the unemployment rate to stay steady below 4%.

But a little bit of sanding removes some of the gilding around these claims.

Really there are two problems with the data: These job growth numbers are misleading, and the unemployment numbers are misleading.

I will talk about how misleading the unemployment numbers are next week.

In the meantime, here’s what the recent job numbers are hiding…

The US is actually hemorrhaging full-time jobs. Over 1.6 million have been lost in the last 3 months.

At the same time, part-time work has been climbing steadily.

And who’s been hiring people?

The sectors adding the most employees are health care, government, and leisure & hospitality.

Take away jobs that are either in government or dominated by the government (health care), and year-over-year job growth is actually negative.

It’s pretty easy to unfold the ramifications of all this data:

* Many of the jobs being created are the product of unsustainable deficit spending.

* At the same time, the part-time jobs being added offer folks fewer hours.

* Fewer hours means less pay.

* Less pay means there’s less wealth circulating among the biggest group of buyers and consumers in the economy.

* Less consumption means less economic activity.

* Less economic activity leads to slower growth or negative growth.

If these trends continue, we are absolutely moving toward a recession.

So I see nothing very little worth celebrating in the Biden administration’s recent press releases about the strength of the US job market.

– Sean MacIntyre

Sean is currently working on a longer video, diving into the details of the current employment situation in the US. Click here and subscribe to his YouTube channel so you don’t miss it.

Yes, Restaurant Prices Are Higher – Considerably Higher!

K and I spent a long weekend in LA at the end of last month visiting Numbers One and Two Sons and their families. Dado (yours truly) was happy to grab the checks when we dined together. There were ten of us – six adults, four children. And we had four meals together – one breakfast, one lunch, and two dinners.

Perhaps it’s a function of my forgetfulness, but each check’s bottom line was higher than I expected. With tip, the breakfast came to $400. The lunch came in a $600. And the dinners were more than $1,000 each.

And we are not talking about Michelin Star restaurants. I’d judge the quality as slightly above middling – i.e., two steps above Applebee’s to four steps below Torrisi.

It seems like just 20 years ago, I was paying $10 to $15 a person for breakfast, $15 to $20 a person for lunch, and $25 to $30 a person for dinner. Am I wrong?

Look, I’m not complaining. I can comfortably afford to spend that kind of money at a restaurant. But what about the 200 million working- and middle-class Americans whose combined median income is less than $80,000 a year?

The Biden administration keeps telling us that the economy is strong and inflation has been whipped. It hasn’t dropped to the much eulogized 2%, but it’s in the 3%s – and that’s something to feel good about.

But polls show that most Americans don’t believe it. And for good reason. The cost of dining out has been rising steadily over the last 10 years – at a rate that exceeds both the CPI (Cost Price Index) and the PCE (Personal Consumption Expenditures Price Index), the two official measurements of inflation.

There are two reasons for that.

First, the CPI and the PCE are fake news. They were rigged years ago when creatures at the swamp decided to no longer include the cost of energy and the cost of food in their calculations. And for working- and middle-class Americans, food and energy comprise a much higher percentage of household spending than it does for wealthier Americans.

A second reason is that two-thirds of the cost of running a restaurant is the cost of labor, which has also accelerated greatly since the multi-trillion-dollar COVID giveaway bribe. And that represents two-thirds of the cost of eating in a restaurant, as opposed to eating grocery-store food at home.

For your further amusement, check out this piece by Michael Snyder, the internet’s most prolific producer of End-of-Times predictions, on the inflation history of the Egg McMuffin.

Chart of the Week: What Effect Do Presidents Have Over the US Economy While They Are in Office? 

Sean took the time here to reinforce something I’ve been saying for years: You can’t fairly judge a president’s economic policies by what happens with the economy during his term. And the reason for that should be obvious. First, many economic policies (and especially those with the potential to have the largest impact) do not result in change overnight. Most take years – often four to six years – to produce a measurable effect. Second, a president’s ability to create or affect economic policies is limited. Its impact is considerably more narrow and weaker than the power of the Federal Reserve. And even that is smaller than the impact of the billions of independent decisions made by businesses, entrepreneurs, and consumers on a daily basis. 

If you understand economics on at least a basic level, you recognize the speciousness of judging a president’s economic policies by the state of the economy during his term. But, as Sean proves below, judging a president’s economic policies by the trajectory of the stock market during his term might be even loonier. Because the stock market responds not just to all the economic, business, and monetary decisions discussed above, but also to the algorithms of computer programs and the psychology of individual investors.

I think there is only one thing a president can do during his term that can have an immediate and substantial effect on the economy and the stock market: Declare war. And that is almost always destructive to both. – MF

I recently made the case that historical data, on multiple fronts, suggest that 2024 will be an “up” year for the stock market.

Probably not great. But also probably not terrible.

In response to this point, I received this reply: “Depends if we still have a dementia patient in the oval office or not.”

Now, I have zero love for Biden. But I would be irresponsibly partisan if I believed anything besides the truth:

The market does not care who the president is. 

To prove this point, I found the inflation-adjusted stock returns for each president since 1974.

Over the last 50 years, here are presidential returns from best to worst:

* Clinton: 150.6%
* Obama: 127%
* Trump: 72.9%
* Reagan: 50.1%
* GHW Bush: 30.3%
* Ford: 18.3% (short term)
* Biden: 5.1% (term not yet concluded)
* Carter: -12.8%
* GW Bush: -45.3%

(Again, these are adjusted for inflation so that we get closer to an apples-to-apples comparison, factoring in economic environments.)

But we have to compare their returns to what we should statistically expect.

Here’s what I found: There’s only one person who presided over unusual, outlier returns.

Bill Clinton.

Everyone else? Including George W. Bush? They all land within 1.5 standard deviations from the mean. They’re all “normal returns” that we should reasonably expect if we’re going to invest over four- or eight-year periods.

That means two things:

First off, the president could be good or bad. The president could have amazing economic policies or terrible ones. The president could be demented or not.

I reiterate: The market does not care who the president is.

Secondly, markets only care about three things when it comes to politics: global stability, legislative gridlock, and fiscal stimulus.

“Slick Willie” had those three things in spades.

The economy (and, by extension, the stock market) responds to fiscal policies put in place by Congress, which the president only has marginal control over, and it responds to global economic conditions.

Would we have had such a crazy bull market in the 1990s if the Soviet Bloc hadn’t fallen, opening dozens of new markets at the same time the technology that catalyzes globalization went mainstream? I highly, highly doubt it.

And that’s why Clinton is the only outlier on that list.

The only presidents who come even remotely close to being unusual in terms of inflation-adjusted stock returns – Obama and Trump – also presided over an era of insanely atypical monetary policy. Which proves Mark’s point above in his introduction that the Fed has more power than the president to shape our economic reality.

– Sean MacIntyre

If you want to know how the market tends to perform in an election year in general, click here to check out the one-minute video Sean did on the subject.

Newsom’s Magnificently Stupid Plan to Fill His State’s $68 Billion Budget Hole 

Governor Newsom and California Democrats are once again “pioneering” an economic idea that is bound to fail.

I don’t know what Orwellian name they’ve coined for the bill, but it’s basically a wealth tax. A wealth tax is an annual excise tax on the worldwide wealth of taxpayers whose net worth exceeds a stated amount.

As is customary with taxing authorities, the wealth tax will be introduced in a way that won’t get great pushback, and then will become more severe after it’s established. In California, during stage one, it would apply only to billionaires, who would be taxed at 1.5% of their worldwide net worth. Few taxpayers will gripe about that, since there are fewer than 200 billionaires that live in California – a number that keeps getting smaller (there were 178 at the beginning of 2023, according to Forbes) because of wealthy Californians fleeing the state’s high taxes. (Not to mention its deteriorating government services, surging homelessness, a flood of illegal immigrants, and rising crime.)

If the bill passes, I’m willing to bet good money that we’ll see the population of California billionaires drop below 100 in the next few years solely because of the tax. And that’s not good. Not only will California lose the tax revenues of these emigres, it will lose thousands of jobs when some of them take their companies with them.

But that’s just the first stage. Come Jan. 1, 2026, the state would begin to impose a 1% wealth tax on all Californians, full- and part-time, whose net worth exceeds $50 million.

The bill, introduced last winter, is being discussed this week in the State Assembly. Its stated purpose is to raise billions in tax revenues to pay for a projected $68 billion budget deficit. If fully enacted, the wealth tax would raise an estimated $21.6 billion in revenue annually. A considerable sum, to be sure. But only about a third as big as the yearly deficit.

And that’s assuming no wealth exodus from the state. But the bill has a partial remedy for that. It includes a clause that would require Californians that leave the state to continue to pay the wealth tax years after they have established residency elsewhere.

To add teeth to the bill and get the support of lawyers, the bill would apply the state’s False Claims Act to wealth-tax records and statements. Which would mean that private attorneys could sue affluent individuals on behalf of the state for allegedly under-reporting assets – for which such attorneys would be entitled to a share of the state’s recovery.

In the meantime, California’s top effective marginal tax rate on wage income this year is increasing to 14.4% from 13.3%, owing to a new law that removes the $145,600 wage ceiling on a 1.1% state employee payroll tax to fund expanded paid family leave.

And the projected budget deficit of $68 billion will increase significantly as the state incorporates Newsom’s promise to give all of the state’s undocumented aliens free healthcare, education, and more.

They’ve tried wealth taxes in Europe in recent years, but it had the same effect there that I’m predicting it will have in California: a dramatic flight of the state’s highest taxpayers, including its largest employers.

And While We Are on the Topic of Fleeing Taxpayers… 

Writing in the Albany Times Union, Chris Churchill reported that the US Census Bureau released end-of-year data on population swings and found that New York suffered another major decline. During the one-year period ending July 1, the state’s estimated population dropped by 101,000, making it the largest in the country in both total and percentage.

The good news, Churchill says, is that population outflow is expected to slow and perhaps even stop. The reason? “Higher mortgage rates are making Americans far less willing and able to move, even when they might otherwise want to.”

“So, there’s a little good news for you,” he says. “More New Yorkers will stay but not because they are happier with their state and lives. They’ll stay because they’re stuck.”

A Fun Example of the Willingness of Political Actors to “Spin” Facts in Their Favor

In mid-January, acting Secretary of Labor Julie Su told the press:

“The Bureau of Labor Statistics reported an increase in union membership, with 139,000 more union members in 2023 than in 2022, meaning this country has 400,000 more union workers than we had in 2021. The gains under the Biden-Harris administration underscore President Biden’s commitment to being the most pro-worker, pro-union president in history.”

But a glance at the full data reveals that the growth in nonunion jobs was considerably greater than the growth in unionized jobs – a fact that is contrary to the point Su was trying to make. To wit:

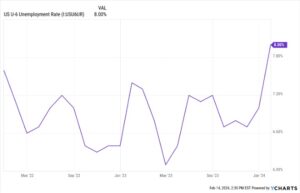
“The US Bureau of Labor Statistics said 10% of hourly and salaried workers were members of unions in 2023, or around 14.4 million people. That is an all-time low, down from 10.1% of workers in 2022.”

Chart of the Week 

Today, Sean explains why, statistically speaking, 2024 is likely to be an up year for stocks. But that doesn’t mean he’s going to be adding to his stock portfolio. He tells you what he’s going to do below… 

With interest rate cuts on the horizon, experts have made fairly positive forecasts for both stocks and bonds in 2024.

Economic data are presenting a number of warning signs. But historical trends in the stock market suggest something pretty straightforward:

The year will probably end with stocks having gone up.

Since 1928, there have been 34 calendar years where the S&P 500 has finished up 20% or more against 26 total down years.

That means there are more “really good” years than “bad” years.

But what happens the year after a “really good” year?

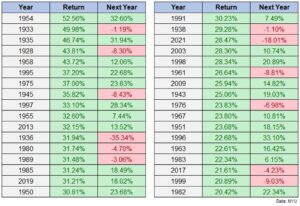
Here’s a summary from A Wealth of Common Sense:

* The stock market was up 22 out of the 34 years following a 20% gain (65% of the time).

* The stock market was down 12 out of the 34 years following a 20% gain (35% of the time).

* The average return following a 20% up year was +8.9%.

* The average gain was +18.8% in up years.

* The average loss was -9.1% in down years.

* There were just two double-digit down years following a +20% year (1936 and 2022).

Simply put: The historical odds are in our favor to see the market rise in 2024.

Now, will that be a steady rise? Will stocks crash and recover, as they’ve done in the past? Will returns be exceptional or humdrum?

The uncertainty around these questions has led me to prefer bonds over stocks in 2024.

– Sean MacIntyre

Click here to see a brief explanation of Sean’s reasoning.

2023 Was a Pretty Good Year for the Global Economy, but… 

Despite widespread global inflation, geopolitical problems, and the economic after-effects of COVID and the lockdowns, the global economy in 2023 did a bit better than most economists expected.

However, in 2024, many of these same economists are saying that the US (and most of the rest of the world) will experience a global economy that is less sanguine.

In its semiannual “Global Economic Report,” the World Bank predicted that the growth of the world’s economy would slow to 2.4%.

That’s not good, because despite the improvement experienced in 2023, a 2.4% growth would still be the third consecutive year of economic deceleration. The report cited “continued higher interest rates, anemic global trade, reduced global investing, and rising geopolitical tensions” as the reasons.

If that turns out to be true, this first quarter of 2024 is the time for business leaders and individual investors to make changes. (I will write more about this in future issues.)

The Problem with Minimum Wage Laws 

Do minimum wage laws work? Are they helpful in improving the lives of our least-skilled workers? The evidence from a hundred studies over the last 20 years is clear. They do not.

And why would that be?

As I’ve mentioned before, by the time a minimum wage is agreed upon, the market demand for minimum-skilled workers is usually as high as the proposed wage or greater.

As I write this, 22 states are lifting pay floors, but many fast-food cooks and housekeepers are already earning more than minimum wage. And that’s because of free-market competition. The COVID shutdown and the move towards working remotely, have made it increasingly difficult for business owners to attract low-wage workers.

As noted in the WSJ:

“Robust raises in recent years have rendered pay floors largely irrelevant, even in states that aggressively lifted them.”

For example: “To start 2024, Washington State will raise the nation’s highest minimum to $16.28 an hour, from $15.74 in 2023. Washington ties its minimum wage to the consumer-price index, a measure of inflation. Hawaii has the largest planned increase, with its minimum wage rising $2, to $14 an hour, in 2024. That is part of a law that will increase the lowest hourly wages in the Aloha State to $18 by 2028. California, New York, and Illinois are also among the states raising the pay floor.

“Most low-wage workers are making well above those minimums. Through September, the lowest 10% of workers by income in each state earned hourly wages that were on average nearly 50% higher than their state’s minimum wages in 2023, according to a WSJ analysis that compared state minimum wages to income estimates from MIT Sloan School of Management professor Nathan Wilmers.

“That is the largest gap between actual pay and minimum pay in a decade.”

Read more here.

Chart of the Week 

This week, Sean MacIntyre talks about the expectation of some economists that we are quickly nearing a worldwide stock market crash. He’s not so sure. And he has another graph with solid analysis and thoughtful explanations to support his thinking. 

Some new stock market forecasts claim that the S&P 500 could dive as much as -86% in 2024.

The reason given for such a crash is usually overvaluation: Index prices have drifted away from what company profits can reasonably support.

But I question this assumption.

Let’s compare the price of the S&P 500 against the most predictive valuation metric – the Shiller CAPE Ratio.

We’ll compare current prices to both the CAPE’s long-term average and its 10-year average.

As I write, the S&P 500 is trading around 4300.

If it fell until its CAPE valuation returned to long-term averages, the S&P 500 would have to drop to about 2900. That’s a -32% drop from current levels. Cataclysmic, especially for retirees.

But what if the S&P 500 fell to its 10-year average CAPE?

The S&P 500 would drop to about 4030 – a -6% drop.

Not nearly as scary.

Many doom-and-gloomers balk at the market’s nosebleed-high valuations. But there are many reasons why this should be the norm.

Since the early 1990s, more Americans own stocks than ever before.

And one of the most popular investment strategies is simply to buy and hold the S&P 500.

It stands to reason that if tens of millions of people keep throwing money at one thing, the value of that thing will go up.

Also, retirement accounts and 401(k)s do not offer many alternatives besides stocks and mutual funds that own stocks. Workers have their money shunted automatically into stocks every month, regardless of valuation.

Finally, since the late 1980s, algorithms have accounted for up to 75% of all stock trading volume. Robots routinely scoop up stocks during downturns and drive prices back up. (They cause crashes sometimes, too.)

Simply put: The fundamental calculus of the market has changed. Investor behavior has changed. The world has changed.

So if there’s a cataclysmic crash coming in stocks… it won’t be because the market is “overvalued.”

– Sean MacIntyre

By the way, Sean is working on a free video that teaches stock valuation on his YouTube channel. Click here and subscribe to be notified when it goes live.

Chart of the Week 

One of the numbskull ideas that have always been part of political discussions is that the ups and downs of the economy and/or the financial markets are responses to the legislative or executive actions promoted by whoever is in the Oval Office at the moment. It doesn’t take a lot of thinking to realize that economic events and changes do not happen that way. There is this thing called gestation that lies between the passage of a law or the declaration of an executive order and the economic and financial effects that result from it. Those gestation periods can be weeks, but are much more often months or years.

It’s an election year. So, this week, Sean takes a look at how stocks perform during such years… 

According to research by LPL Financial, “the S&P 500 has generated an average gain of 7% during presidential election years dating back to the 1952 election.”

That’s below the market’s long-term averages – but not catastrophically so.

But the data gets more interesting when broken down further.

In years when we have a “lame duck” president – one who has served two terms already – the average return for the S&P 500 is an abysmal -0.4%.

But in years when a president is seeking reelection, like 2024, the average return of the market is 12.2%.

Why? Typically, the incumbent party tries to “prime the pump” before the election.

Whether it’s Republican tax cuts or Democrat handouts, this works by pushing more money into the US economy, encouraging growth.

You may ask: “Won’t this add to America’s insane deficits and debt levels? Won’t this make the US more susceptible to another inflation spike?”

Well, yes. But those are all problems for whoever is in office in 2025.

– Sean MacIntyre

Click here for Sean’s prediction for what will happen with inflation in the coming years.

Chart of the Week

This week, Sean provides a chart on US household spending that shows an uptrend in investment in stocks. The WSJ says it’s because it’s easier than ever to buy stocks. But Sean has a different and more alarming take… 

According to the Federal Reserve’s survey of consumer finances, more US households own stocks than ever before.

58% of Americans own stocks in their retirement accounts, while over 20% directly own them in taxable brokerage accounts.

According to The Wall Street Journal, this surge of stock ownership comes from “the elimination of commission fees,” which makes investing cheaper and easier than ever. Many brokerages now allow fractional trading as well, permitting individual investors to purchase a sliver of stocks like BRK.A with only a $1.

These theories are all fine and good. But I can actually read a chart.

When did previous spikes in stock ownership occur?

1998-2001, at the beginning of the dotcom collapse. 2007, right before the Great Recession. 2016, right before the Fed tightening cycle that led to a precipitous drop in 2018.

We’re just witnessing a tale as old as time: people chasing past returns. Plus a dash of asset inflation.

Another thing: Most of these assets are in retirement accounts. Retirement accounts, notoriously, do not offer many easy options to invest in besides stocks. This asset class, for the majority of Americans, is the only game in town.

But in late 2022, conditions looked right to begin investing in gold. Between that and my big tech recommendations, it paid off for my family and my readers.

Now I have my eyes set on a new non-stock asset class that I’ve been pouring money into for 2024. – Sean MacIntyre

Click here to find out the asset class that Sean says is moving “into the limelight.”

What Is the Future for Stocks Over the Next Five Years? 

Just before publication, I asked Sean MacIntyre, who, along with my broker Dominick, has been managing the stock portfolio I set up ten years ago, if he could tell us what he foresees for stock investing in the near future. This is what he had to say… 

For one of my recent video posts, I wanted to answer a simple question: “What does the economic data suggest the S&P 500 will do over the next five years?”

I did a regression analysis of the five econometrics most highly correlated with future returns. Here’s how they’re suggest the S&P 500 will perform in the next five years based on past trends:

* US Housing Starts: 8.5% per year
* Fed Interest Rates: 8.9% per year
* Delinquent Auto Loans: 14.1% per year
* 10-year Treasury Yields: 6.7% per year
* Shiller Excess CAPE Yields: 8% per year

Average it all up and you get what the market has just about always done: 9.2% per year.

Honestly, this finding was a little frustrating. I wanted something more definitive so I could declare that we “BUY NOW” or “CRASH INCOMING.”

But all these data suggest things will be as they have always been. And “average returns” has always been a mixed bag.

The market could climb from here and then fall, as it did for folks who bought in 1998 or 2020.

The market could go all over the place, as it did in the 70s.

Or the market can drop for years before climbing again, which seems most likely at the moment.

Each of these scenarios ends with people achieving “average returns.” They are mathematically the same.

But they are psychologically very different. After all, how excited will you be about buying more stocks if they fall for the next two years?

The point is, we can’t know what the future holds. Given enough time, things tend to average out to what they’ve done historically.

It’s just a matter of investing with the right mindset, patience, and an understanding of everything that might happen along the way so that you don’t make emotional decisions that destroy your wealth.

If you want some more investing tips, economic insights, and findings both exciting and disappointing, check out my YouTube channel here.

Clip of the Week: Not a Great Time to Buy a New Home 

Home sales fell to a 13-year low in October – presumably because interest rates are still pretty high and home prices haven’t come down hard enough to meet demand. According to the National Association of Realtors, existing-home sales (which make up most of the housing market) decreased 4.1% in October for a seasonally adjusted annual rate of 3.79%. That’s the lowest since August 2010.

It’s still a question as to what the Fed is going to do with the Fed rate, but I’m betting that home prices will be coming down significantly in the next 6 to 12 months. If I needed to sell my home any time soon, I’d think about upping the ask considerably.

Chart of the Week: How Likely Is Another Recession?

“There is a 95% probability a recession will occur before January 2025,” says my friend and colleague Sean McIntyre in his most recent newsletter. You can read his argument here.

Economic Craziness of the Week: The Only Good News About the Bad News 

Janet Yellen and the Biden administration are telling us that, thanks to “Bidenomics,” the US economy is stable and getting stronger, with inflation rates descending and employment moving up. Yet, according to some poll I read somewhere last week, Americans are more stressed about their finances now than they have been in years.

There are good reasons for that.

According to the Social Security Administration, the median wage earner brought home just $40,847.18, or about $3,400 a month, in 2022. Of course, that’s before federal income taxes are withheld, about $500 a month, and another $300 for Social Security and Medicare. The net take home is $2,600. About $2,000 of that will cover the cost of renting a house. Which leaves what? $600 to pay for food, gas, utilities, etc.

And to cope with that, millions of Americans are borrowing and going into debt fast. Balances on non-housing loans have more than doubled since 2003, totaling roughly $4.8 trillion, according to data from the New York Federal Reserve. More than $500 billion of that debt accumulated just in the past two years – a bigger jump than any other two-year period since 2003, the earliest data available. And credit card balances are growing the fastest of all – up roughly 34% from the fall of 2021.

It doesn’t sound like things are improving, but what do I know? In any case, there is a sliver of silver lining to the cloud of bad news. The crazy cost of housing is encouraging divorced and separated couples to move back into one house and try to work things out.

Click here.

Clip of the Week: Loans from Uncle Warren 

From Garrett Baldwin, writing in Postcards from the Florida Republic:

“Let’s talk about the Warren Buffett Closed-End Fund. A lot of people avoid closed-end funds because of their misunderstanding of risk. But let’s do a quick recap.

“Let’s say a money manager opens a new fund portfolio comprising stocks, bonds, or other investments. The manager sells a fixed number of shares on an exchange like the NYSE. Because it’s fixed, there will never be more shares issued. Investors buy the shares, which trade on a stock market like any other equity.

“But here’s the important part. Closed-end funds don’t trade like mutual funds and mirror their net asset value (NAV) at the end of the trading day. Instead, they are disconnected from their NAV. They trade irrationally. Sometimes, closed-end funds trade at a premium to the total fund’s net asset value.

“However, sometimes, they will trade at a discount. Imagine there’s a closed-end fund that trades at $18 per share. But the NAV may sit at $20. In this case, the fund trades at a 10% discount to its NAV…”

That could represent a very interesting opportunity… Continue reading here.


Chart of the Week: Office Rentals Are Getting Weaker 

The office sector’s credit crunch is intensifying. By one measure, it’s now worse than during the 2008-09 global financial crisis. Only one out of every three securitized office mortgages that expired during the first nine months of 2023 was paid off by the end of September, according to

Moody’s Analytics. That is the smallest share for the first nine months of any year since at least 2008. The reason: Many office owners can’t pay back their old loans because they can’t get new mortgages. Click here.

Economic Craziness of the Week: Biden Administration Encourages Money Managers to Push ESG Investing 

President Joe Biden’s Labor Department recently announced a new rule that will encourage money managers to put their clients’ money in what they call “environmental, social, and governance investing” (ESG). It allows them to ignore their fiduciary duties to provide their clients with the highest possible returns on their investments, based purely on financial and economic projections, in favor of funds that may be considerably weaker on the books, but have the “virtue” of being invested in companies that have high ratings in terms of social and environmental issues.

“Socially conscious investing has been around for decades,” says Stephen Moore, writing in a recent issue of Taki’s Magazine. “I have no problem with individual shareholders choosing to invest in such stocks. But it’s an entirely different matter when trillion-dollar investment and retirement funds such as BlackRock inject their own biases into the way they invest people’s savings without their knowledge or consent.

“To make matters worse, researchers at Columbia University and the London School of Economics found ESG funds may not even be achieving their goals. The study compared the ESG records of American companies in 147 ESG fund portfolios to ones in over 2,000 non-ESG portfolios and found that the ESG companies were often worse when it came to labor and environmental law compliance.”